Progress
Data Analysis serves to visualize information and statistics on your project. In the "Progress"-tab you are able to see the worktime statistics of your trades and you are also able to plan their work hours.
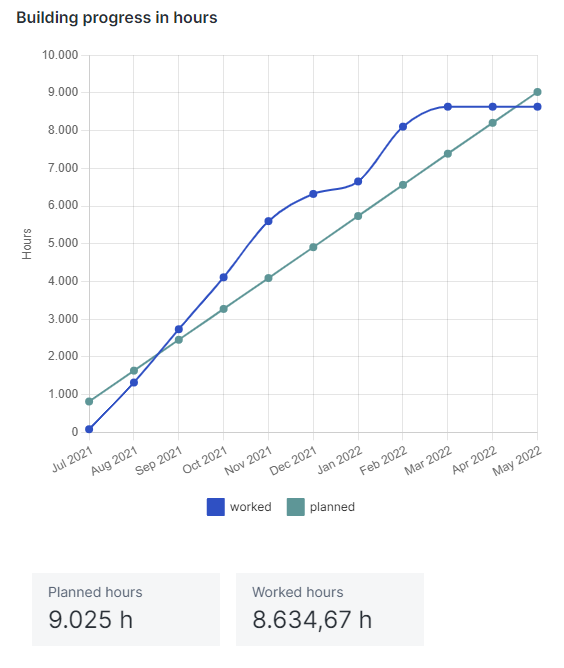
Building Progress in Hours
Here you are able to visualize the hours your trades have worked on the project. In order to do this select a trade at the top of the page and select a timeframe to be displayed.
 |
|---|
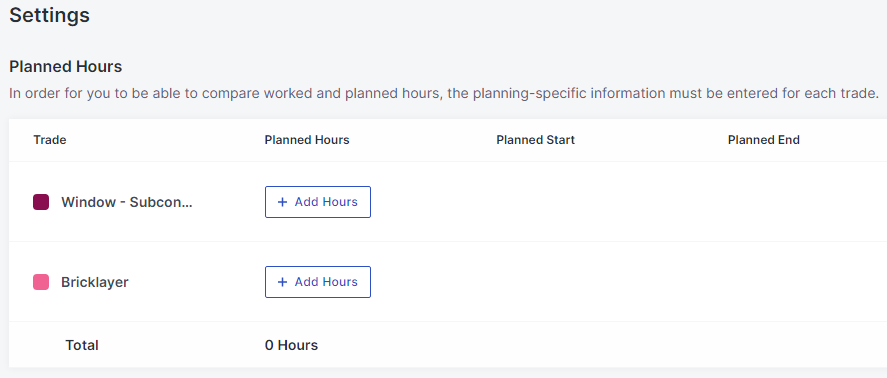
Afterwards you can see the work hours of these trades displayed in a graph. In order to display the planned amount of work hours, you need to assign them to the trades. Select the tab "Settings". Here all trades and their planned work hours are listed.
If a trade has no timevalue assigned, you are able to do it by clicking on "+ Add Hours". If a timevalue is already assigned you are able to change it by clicking on the edit-symbol.
 |
|---|
This value also gets displayed by a graph.
 |
|---|
On the right side of the graphs is a viewer, which shows the default view of the selected trade.
By clicking on "Switch view" on top of the viewer you are able to select another view.